Advanced diagnostics for orthopedic & sports related injury (Proceedings)
Identifying the cause of forelimb and hind limb lameness in dogs can be a challenge. Until recently, diagnostics in small animal orthopedics included visual gait analysis and radiographs. With advanced diagnostics becoming more readily available (objective gait analysis, CT scan, MRI, ultrasound, nuclear scintigraphy, arthroscopy, etc) clinicians can now obtain a definitive diagnosis to those challenging conditions.
Identifying the cause of forelimb and hind limb lameness in dogs can be a challenge. Until recently, diagnostics in small animal orthopedics included visual gait analysis and radiographs. With advanced diagnostics becoming more readily available (objective gait analysis, CT scan, MRI, ultrasound, nuclear scintigraphy, arthroscopy, etc) clinicians can now obtain a definitive diagnosis to those challenging conditions.
Gait Analysis
Quantitative analysis of animal motion can provide unique insight into normal and abnormal limb function. This information is useful clinically for the diagnosis of disease and as a measure of outcome following treatment intervention. Historically, gait analysis has been cumbersome and time-consuming. Dramatic computational and equipment improvements over the past ten years, however, have made these techniques readily available for routine assessment of gait in a modern-day hospital. Perhaps the most attractive draw to gait analysis is that many methods produces objective data of limb function.
The most common techniques used to measure outcomes in veterinary medicine are visual observation of gait and force platform gait analysis (measuring of ground reaction forces) Other, less frequently used, methods of analyzing gait in animals include the use of 2D or 3D kinematics, accelerometers, electromyography, electrogoniometry, roentgenographic and magnetic coupling methods. Some of these methods are practical for clinical use, others are not.
Visual Observation of Gait
The entire gait cycle lasts for only one second thus; a systematic and disciplined approach must be used to clinically evaluate a patient's gait. To document this in the medical record one could semiquantify the findings by using a visual analog scale or numerical rating scale. Regardless of what mechanism two important facts are that visual observation of gait is subjective and the scientific literature would strongly suggest it is unreliable. For example, in one publication when the sensitivity of visual observation of gait was compared to that of force platform gait analysis, visual observation was found to be vastly inferior. In this comparison they evaluated 148 adult Labrador Retrievers, 17 were free of orthopedic and neurologic abnormalities and 131 were 6-months after surgery for unilateral CCL injury. The observer was blinded to the dog's group assignment. Of the 17 normal dogs the observer correctly identified all as having no gait abnormality, as did the force platform. However, the observer only identified 15 of 131 dogs' 6-months after knee surgery as not being normal. Using ground reaction forces from force platform gait analysis, 75% of 131 dogs failed to achieve GRFs consistent with sound Labradors. In this paper if a dog looked lame it was lame, but if it looked normal by the observer it may in fact have been very abnormal. In another recent publication that tried to validate clinician observation of gait neither trained or untrained (first semester veterinary students) observers could reliably identify lameness, there were large disagreements between individuals and that untrained observers had the same visual acuity for dog lameness as boarded surgeons. (Waxman et al. 2008). The only saving grace was a finding that trained clinicians provided repeatable data; i.e. they consistently made the same mistake. This would allow a clinician to compare groups over time, but not necessarily comment success or failure of an individual dog. It should not be surprising that a computational gait analysis is more sensitive than our powers of observation. This fact should be remembered when we inform an owner that a dog, "has returned to normal" after a clinical exam.
Pedometers and Accelerometers
The greatest limitation to data that is collected at a veterinary hospital is that it measures a moment in time, not the day to day level of activity of the dog at home. Use of a pedometer or accelerometer can be used to measure patient activity level at home over an extended period of time. In one study pedometers were successfully used to measure physical activity in dogs over a 14 day period. Pedometer accuracy varied depending upon the patient's size (overestimated walking in large dogs and underestimated walking in small dogs), but correlated well to overall reports of the dogs activity level at home and the dog's condition body score. Accelerometers are a bit more sophisticated in that some can measure changes in acceleration in the x-, y- and z- axis. Thus, body movement in any direction is measured. In one study that determined variability in accelerometer data in companion dogs it was reported that large day-to-day and even week-to-week variations occurred in dogs but within dogs, a full 7-day comparison of total activity counts from one week to the next provided the least variable estimate of the dogs' activity. They also reported that accelerometers may be most useful for documenting changes in the dog's activity over time. Given the limitations both pedometers and accelerometers have in their estimates of a patient's activity level these methods are probably suited for use in studies that wish to compare large groups of dogs that have similar body size and shape. To the authors knowledge these methods have not been applied to dogs after RCCL surgery and their use would be beneficial for outcome comparisons.
Force Platform Gait Analysis
A force platform measures the ground reaction forces (GRF) exerted when it is stepped on during the stance phase. It is important to note that measuring GRFs via a force platform is exceeding sensitive, precise and reproducible in clinical patients. This data should be considered the gold standard as it uses state-of-the-art engineering designs to report data based on Newton's laws. Force platforms consist of one or more metal plate(s) that is mounted level with the surrounding floor or walkway that is separated from a bottom frame by force transducers near each corner. Forces in an X, Y or Z direction that are exerted on the top surface are transmitted through the force transducers. Commercially available force plates are frequently grouped into either piezoelectric or strain gauge. While there are subtle differences in the capabilities and cost of the two types, for clinical gait applications, the type used probably has little influence on the data generated. Piezoelectric force plates utilize quartz transducers, which generate an electric charge when stressed. Strain gauge force plates utilize strain gauges to measure the stress in load cells when a force is applied. Although the raw data can be worked with in most any data software (e.g. excel) commercially available software for dogs has simplified the process. The size of the force platform, transparency (if photography under the platform is desired), portability, and use with a treadmill (only z direction forces can be measured) are all things to consider when setting up a gait lab. A final important consideration is professional installation in an area that encourages frequent clinical use but avoids abuse from general hallway traffic.
Pressure Platforms and Walkways
Pressure platforms are comparatively new, allow clinicians to measure both temporal and spatial gait parameters, and some can be linked to create pressure walkways that are several meters in length. These platforms function using a sensor pad that is an ultra thin (~0.1mm) flexible printed circuit. Contained within the circuit are thousands of pressure sensing locations, or elements, arranged in rows and columns along the length and width of the platform or walkway. The sensing elements act as variable resistors within an electrical circuit. When the sensors are loaded their resistance is very low; when the force is reduced, resistance increases. The output resistance created is then converted to a raw sum for use in analysis. In effect, this allows one to measure ground reaction forces in the z-force direction. Sensors can be produced with pressure ranges from as low as 0-5 psi to as high as 0-25,000 psi. Perhaps it is important to note that ground reaction forces generated from normal dogs on pressure walkways has been shown to parallel that of force platforms.
There are several advantages to using a pressure walkway. First, because of its extended length, multiple readings and simultaneous, consecutive and contralateral foot-strikes can be recorded with a single pass over the walkway. Some of this advantage can be attenuated if a laboratory is equipped with multiple force platforms. A single force platform, however, can only measure ½ of a gait cycle in a single pass or trial. Thus by increasing the length of the measuring field one not only gathers data that is more reflective of the patient's gait but fewer trials are needed to generate an adequate amount of data for statistical comparison. Reducing trial repetition is important because it saves time, some weak or lame patients may not be able to physically perform many trials, and the majority of variance in force platform data is attributable to trial repetition. Second, since the geometry of the mat is known, spatial parameters of gait can be calculated. Patient stride length and width for each limb can be measured for consecutive steps allowing the clinician to look for inconsistencies, improvements or disease progression. Limb velocity and acceleration can be calculated using this data or they can be measured using a speed gun or photoelectric cells. Third, the distribution of pressure from the entire foot can be investigated. Both types of platforms measure cumulative force(s) over the cell. For pressure platforms the cell is usually 0.25-square centimeters and for a traditional force platform the cell is 3-square feet. This difference allows for clinicians to estimate changes in load over the patient's foot, e.g. is load being shifted to the left side of the foot because of an injury on the right. Fourth, because of the small size of the cell in pressure platforms there are few limitations in the size of the animal in which data can be accurately collected. Using a traditional force platform, a dog's stride length must be long enough such that it place only one foot on the platform at a time. In general, dogs under 20-kg will have a difficult time accomplishing this. Likewise an extremely tall dog with a long stride may step over a traditional force platform. Increasing the animal's velocity through the gaited area will increase its stride length but this methodology creates other limitations. Since pressure platforms allow for data collection in animals with a very short stride length they provide the opportunity to measure limb function in small dogs, cats or in large dogs that have a short stride length because of disease or because they are recovering from surgery. Finally, pressure platforms are easy to set-up, break-down and move to a different location. This portability provides opportunities to measure limb function that would otherwise be impossible with a traditional force platform.
Unfortunately, pressure platforms have some disadvantages. One drawback is that they can only measure total GRF. Forces are not deciphered between the x-, y-, and z-direction. Second, while other platform systems have components that incorporate velocity and acceleration data for each trial, most pressure platform systems do not. Pressure platforms are also not nearly as durable as a metal force platform. Finally, the many advantages of pressure platforms come with a significant cost.
Kinematic Analysis of Gait
The stereometric method of documenting kinematics employs visible markers that are attached to the skin on rigid segments of the body (e.g. joints centers of rotation or bony prominences) and tracks their motion using imaging equipment. Using triangulation of the views from an array of cameras and the known location of each camera, computer software computes the coordinates for each marker. Two-dimensional methods have a diminished time and financial investment for the laboratory or clinic that will only perform this method occasionally but joint motions can only be determined in one plane. Three-dimensional methods generally employ the use of 3-8 cameras. Motion data allows for calculation of time/distance parameters (velocity, cadence, stance and swing times, etc.) and the angular position of the joints (hips, knees, and ankles) during the different phases of gait. These methods have been well described and demonstrated in both normal dogs at a trot, in dogs with orthopedic disease and in dogs swimming.
Radiographs and CT Scan
Forelimb lameness can be a diagnostic challenge in the athletic dog; often the lameness has been treated for months with no improvement. The only abnormal physical finding may be the observation of Grade 2 or Grade 3 lameness. The source of lameness may be attributed to soft tissue injury, bony injury or a combination of both. In the active adult dog the most common cause of latent forelimb lameness can be attributed to pathology in the elbow and to injury of the active and passive shoulder restraints. In the author's experience, pathology in the elbow is regularly caused by occult microfracture/fragmentation of the medial coronoid process. There is no joint effusion, loss of motion, pain, or crepitus on physical examination. Radiographs are reported as normal or may show minimal subtrochlear sclerosis of the ulna. Fig 1
Modalities to facilitate an accurate diagnosis in these cases are CT, nuclear scan, and arthroscopy. Recommendations for performing CT include scanning from the point of the olecranon to 2cm distal to the radial head. Scan thickness should be 1-2mm with .5mm overlapping slice index. Transverse slices using 1500 to 3500 HU are ideal for imaging subchondral bone and fragments of the medial coronoid; transverse images at 3500HU are considered ideal for identifying ostomalacic lesions of the medial coronoid.
Nuclear Scintigraphy
Nuclear scintigraphy can be used to localize the origin of the lameness and can be used to facilitate detection of subtle pathologic changes before changes are evident of radiographs. Technetium phosphonates are typically used for scintigraphy of joint tissues. Scintigraphy has high sensitivity for detection of presence of elbow pathology but is not specific for definitive diagnosis. Regulatory issues often limit the use of scintigraphy to academic institutions or large referral practices. Nevertheless it is invaluable facilitating lesion localization in dogs with forelimb lameness. Most commonly, it is used to rule in or rule out elbow pathology. Note in the cases shown below the uptake in technetium in the involved elbow compared to the normal elbow. Each of the below cases had a long standing undiagnosed forelimb lameness. Radiographs of these cases were considered within normal limits. The use of scintigraphy localized the lesion to the elbow which then allowed application of more specific diagnostic modalities such as CT or arthroscopy.
Arthroscopy
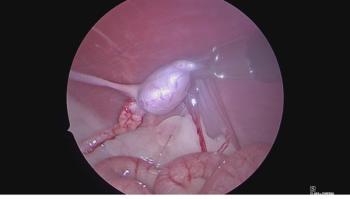
Arthroscopy is more invasive than imaging modalities but is very specific for identification of pathology in the medial compartment of the elbow. A comparison of CT with arthroscopy showed that these procedures were complimentary for medial coronoid assessment. Care must be exercised when assessing the medial coronoid on CT and arthroscopically. Fragmentation of the articular cartilage, micro fissures and nondisplaced fragments may not be detected on CT. Likewise, with arthroscopy, thorough probing and or curettage adjacent to the radial head often will reveal abnormal bone or fragments beneath the cartilage surface not visualized on with casual observation.
Passive and active restraints of the shoulder joint may present as subtle injuries difficult which are difficult to identify. Medial restraint (cranial arm of the medial collateral ligament) injury may occur resulting in subluxation of the glenohumeral joint. The hall mark of diagnosis on physical exam is the abduction test. Comparing abduction of the involved limb with the normal limb will show a side to side difference in abduction laxity. Caution must be exercised when performing the exam that internal rotation of the shoulder does not accompany abduction. If the latter is the case, a false positive test will result; as such, the shoulder must be kept in neutral position when abducting the limb. Additionally, a dog with a long standing lameness will have cuff muscle atrophy which will give a false positive abduction test. MRI has been used to identify normal restraints in the shoulder as well as identify abnormal mild lesions in the shoulder. Although early evidence shows this to be a viable modality, it is not widely available.
Bicipital tenosynovitis is an inflammation of the biceps brachii tendon and its surrounding synovial sheath. The etiology of bicipital tenosynovitis is either direct or indirect trauma to the bicipital tendon or tendon sheath. Direct trauma due to repetitive injury may be an inciting factor and result in partial or complete tearing of the tendon. Indirect trauma secondary to proliferative fibrous connective tissue, osteophytes or adhesions between the tendon and sheath limit motion and cause pain. It has been hypothesized that thickening or mineralization of the supraspinatus tendon causes a secondary mechanical bicipital tenosynovitis. Radiographically, bone resorption at the supraglenoid tuberosity is characteristic of chronic strain at the origin of the biceps tendon.
Ultrasound
Ultrasound of the cuff muscles is also a useful modality for diagnosing cuff muscle injury and differentiating which muscle(s) is involved.
Torn biceps
Rear limb lameness: Athletic dogs will exhibit ligament sprains and muscle tendon unit strains of the rear limb. Lameness may be subtle and exacerbated with activity. Examples of muscle tendon unit strain are iliopsoas muscle strain, gracilis muscle strain, and achillis tendon unit strain. The diagnostic modality most useful is ultrasound. There may be muscle/tendon fiber disruption or evidence of hemorrhage/inflammatory effusion surrounding the tendon. Ligament sprains include early partial CCL injury, medial or lateral tarsal collateral ligament injury, collateral ligament injury of the phalanges. Other injuries causing rear limb lameness are isolated meniscal tear or late meniscal injury following surgery for a torn CCL. Of these, an early partial CCL injury is most common. Diagnostic modalities include radiographs, ultrasound, and MRI. Radiographs are generally sufficient for early diagnosis of CCL injury. Early diagnosis is dependent upon radiographic presence of joint effusion. A radiolucent line adjacent to the caudal joint capsule is representative of fatty tissue in the space between the joint capsule and popliteal muscle. Caudal displacement of this line is representative of joint effusion. This is one of the earliest radiographic indications of partial anterior cruciate ligament injury. As changes progress, typical radiographic signs of DJD will be noted.
Examination of intra-articular structures via arthroscopic intervention is a valid method for early diagnosis of CCL injury, isolated meniscal injury, or late meniscal injury. Standard portals are used and a limited viewing window created with a motorized shaver. Extreme caution must be undertaken not to inadvertently injury function CCL fibers.
Ultrasound has been reported by Christi Cook as being a valuable method for the diagnosis of meniscal injury in the dog. MRI is commonly used in man and may be valuable for imaging the meniscus in the dog.
Newsletter
From exam room tips to practice management insights, get trusted veterinary news delivered straight to your inbox—subscribe to dvm360.


