Equine-industry report tracks vaccine use, census, management
Fortcollins, Colo.-While about three quarters of equine operations vaccinated their horses in 2005,veterinarians performed the task on just half of those farms.
FORTCOLLINS, COLO.—While about three quarters of equine operations vaccinated their horses in 2005,veterinarians performed the task on just half of those farms.

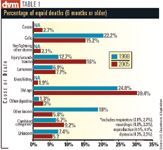
TABLE 1: Percentage of equid deaths (6 months or older)
The data came from the U.S. Department of Agriculture's National Animal Health Monitoring System's (NAHMS) latest findings of the nation's equine industry in the report, "Equine 2005: Part II: Changes in the U.S. Equine Industry, 1998-2005."
The report provides an in-depth look at vaccine use, equine census, management issues and biosecurity.
"This part of the NAHMS study allows practitioners to compare clients' equine management with national and regional estimates," says Josie Traub-Dargatz, DVM, professor of equine medicine and epidemiology at Colorado State University College of Veterinary Medicine and Biomedical Sciences, who contributed to the report.
"For example, not all operations vaccinated horses. That may indicate an area where veterinarians may be able to expand (veterinary care) to operations that didn't vaccinate."
Part II is divided into three sections:
Section I highlights demographic changes in the U.S. equine population from a historical perspective, based on data from the National Agricultural Statistics Service (NASS),Census of Agriculture and the U.S. Census Bureau.
Section II provides data on various diseases, including equine infectious anemia (EIA),West Nile virus (WNV) and vesicular stomatitis.
In Section III, results from the two NAHMS studies (Equine 1998 and Equine 2005) show the evolution of U.S. equine management and health.
Here is a synopsis of the latest (2005) report:
Section 1: Demographics
In 2002, the total number of equids on farms in the United States was 3.7 million, compared with 4.9 million in 1850. The 3.7 million represent a 19.3 percent increase from the number in the 1997 Census.
A total of 552,900 farms had equids in 2002, a 10.2 percent increase from 1997.
For comparison, the number of equid farms is three-fourths the number of farms with beef cows, six times the number of farms with milk cows and seven times the number of hog and sheep farms.
Texas led all states with 10.2 percent of the total horses and ponies (372,300 head on 62,800 farms), followed by Kentucky, Oklahoma and Tennessee (with about 150,000 head each).
Section II: Disease surveillance
The number of equine infectious anemia (EIA) tests performed increased to more than 2 million in 2005, attributed to greater disease awareness, changes in testing regulations, more animal transport requiring testing and the increase in equine numbers.
The number of positive EIA tests has been declining, from approximately 4 percent in 1972 to 0.1 percent in 2005.
West Nile virus cases dropped sharply after the vaccine was fully licensed in 2003 – from 15,257 reported cases in 41 states in 2002 to 5,181 reported cases in 2003.
Besides the vaccine, other factors contributing to the reduction include changes in the virus' ecology, increased vector control efforts and acquired immunity by some horses.
In 2004, WNV cases dropped to just over 1,000, led by California (more than 450 per year),followed by Arizona, Nevada, and Texas. By 2005, only Idaho and California had more than 100 cases.
"Now WNV is the vaccine given by the largest percentage of U.S. operations," Traub-Dargatz says. "This is a good example of the industry having a need, pharmaceutical companies responding to that need and veterinarians playing a role in education and implementation of that health-care strategy."
There were five reported outbreaks of vesicular stomatitis in the nation from 1995 to 2005, mostly in western states.
Section III: Management
Both the 1998 and 2005 reports covered 28 states, 78 percent of all equids and 78.6 percent of locations in the country that have at least five equids. The sample involved 3,349 operations.
Here are highlights:
Health maintenance records. The number of operations that deferred to a veterinarian to maintain records increased from 11.8 percent in 1998 to 20.2 percent in 2005.
Vaccinations. The portion of operations that administered vaccinations grew from 62.4 percent in 1998 to 76 percent in 2005.Veterinarians administered vaccines at 40.7 percent of operations in 1998 and at 50.3 percent of them in 2005.Most common vaccines given were tetanus, eastern and western equine encephalitis and flu vaccines – all of which were administered at more than 50 percent of operations from 1998 to 2005. For those facilities giving only one vaccine, that vaccine most often was WNV.
"What's very positive regarding vaccines is that what we, as veterinarians, consider to be the core vaccines (i.e., every horse should have them) are the ones people are most commonly giving. This illustrates the veterinary education given to horse owners and also the commitment from the horse industry to protect animals. It shows good evidence that people are doing what their veterinarians are very likely recommending," Traub-Dargatz says.
Biosecurity. "Here's an opportunity for veterinarians to work with their clients to talk about options for control of infectious diseases. The information in this report pertaining to biosecurity gives practitioners an idea on a national and regional scale what other operations are doing and how their operations compare," Traub-Dargatz says.
One-of-a-kind report
Although this report is modeled after others from NAHMS, "there really are no other reports quite like this one," Traub-Dargatz says. "When you just look at the tables, you don't necessarily comprehend what goes into these studies.
"Data were collected in person ... (via questionnaire) in 2005.All data are validated, analyzed, summarized and interpreted. ...To pull all of this together and review it gives you a more cohesive view of that information," she adds.
"This kind of health information gives our industry a lot of credibility for what we do, and gives an idea of how things are changing," Traub-Dargatz says.
One final report, "Equine 2005: Event Report," will be released soon, she says.
For more information about the studies, visit www.nahms.aphis.usda.gov.