How to chart associate salary
Heres how this veterinary practice COO/CFO uses two charts to inspire unmotivated doctors and eager new hires alike.
I've found that roughly 80 percent of veterinary hospital revenue is generated by the work of doctors. So a major metric for our multi-hospital chain is doctor's production per shift. It's an apples-to-apples comparison of doctors working within a group.
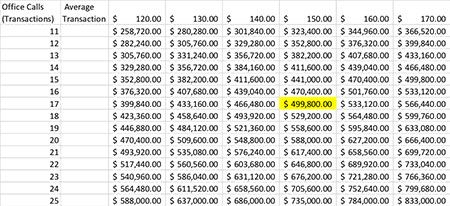
The model is known as the “production matrix.” It disaggregates production per shift into “Transaction per day” multiplied by “Average transaction ($).” It shows doctors what they must do in a day to achieve a desired salary and to meet the hospital's expectations, and it helps managers set the staff schedule based on shared expectations with the doctors.
Yearly practice production matrix

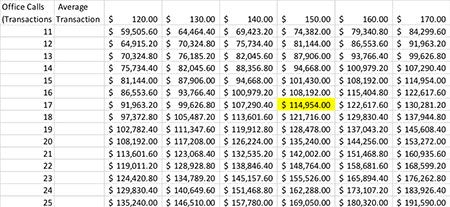
Yearly doctor salary matrix

The two matrices above are two sides of the same coin: Each cell corresponds to the other table's cells.
First, look at the highlighted cell in the “Yearly practice production matrix.” Based on a 40-hour workweek (four days, 10 hours a shift) and accounting for three weeks of vacation, a doctor can earn for the hospital around $500,000 ($499,800) in yearly revenue by doing 17 office exams each day at an average cost of $150.
Next, look at the highlighted cell on the “Yearly doctor salary matrix.” Using a commission of 23 percent for the doctor, we can calculate a doctor's salary as roughly $115,000 ($114,954).
Why these matrices are cool
You can use a tool like this in hiring or salary negotiations. Typically, a new doctor has a desired salary in mind, and an existing doctor hopes for a higher salary. Using the production matrix can help hospitals, doctors and managers see what's needed to achieve everyone's goals, individually and organizationally. The production matrix organizes information into an easy-to-read table everyone can understand, and it's worked for us.
One recent new hire wanted a $180,000 starting salary. At first, the medical director said the hospital couldn't afford that. We told him it could-if the doctor exceeded $180,000 in commissions. He would just have to do it through high enough daily transactions at a high enough average transaction. We showed the new hire the matrix. He found his salary, looked at the 25 exams a day and $160 average transaction and said, yes, he could do it. The expectations were clear on both sides. This doctor has been with the group for a year now and has far exceeded his $180,000 in commissions.
In another case, one of the group's existing doctors was underperforming. We, along with other doctors and managers, had a difficult time motivating him. So I printed out this matrix and showed it to him. Within a month, his average monthly production increased by 50 percent. He wanted to earn more and saw how he had to do it, without any pushing from medical directors or management. This is an effective tool for setting goals.
The matrix has also proven extremely helpful for our group's general managers. By working with doctors and using this tool, managers and doctors came to a better agreement on the client-doctor receiving schedule as well. Again, this matrix makes the expectations, communication and goal-setting much clearer and the processes more streamlined and efficient.
Sachin Trivedi, MBA, is COO and CFO of multi-practice chain Southern California Veterinary Group.